
In early 2013, I began work on a tutorial project that partnered the company I worked for, North Wind Resource Consulting, along with the Idaho National Lab (INL) and Millennium Challenge Corporation. This project would grow to include a small tutorial workbook and an accompanying presentation to be delivered to public officials in Malawi, Africa. The primary purpose of these materials was to give these officials an overview of how to use Geographic Information Systems software and how it could benefit their government in its management of resources. While I was the main architect of this document, the project consisted of a three-person team, and we collaborated on what would be included in the tutorial and presentation materials.
I began with a survey of Free and Open Source Software for GIS (FOSS4G) applications available the time. The three major applications I reviewed were Quantum GIS (QGIS), Geographic Resources Analysis Support System (GRASS), and MapWindow 4.x. I evaluated each of the applications based on the ease of use of several basic GIS functions including, but not limited to, creating and editing a shapefile, projection, shapefile analysis functions, map algebra, and data manipulation. After surveying the applications MapWindow scored the highest and given I had spent numerous hours with students learning ArcGIS, I felt that it would be the easiest application for a novice GISer to begin with.
With the application chosen our team began the process of assembling the tutorial workbook. Aside from an introductory section on MapWindow, we settled on six areas on which to focus our instruction and each chapter consisted of an instruction section and guided exercises. Those chapters were:

- Shapefile Operations
This chapter focused on the basics of working with shapefiles. It starts off by explaining how to create and edit shapefiles. This included instruction on working with data in the shapefile’s attribute table, manipulating that data through the field calculator, and viewing layer property information by clicking on features in the mapping window interface.
- Projections
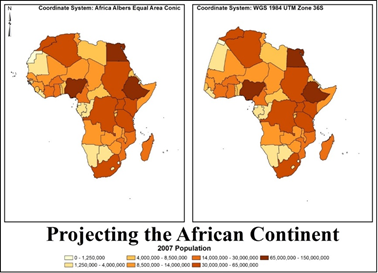
Projections are an important part of working with geospatial information and this was explained in detail throughout this chapter. I covered choosing proper projections to minimize distortion for the tasks at hand and how to use projections in MapWindow. Since we were presenting this information to professionals in Africa, I used a really interesting projection example that demonstrated extensive distortion in western Africa using the Universal Transverse Mercator (UTM) projection. I compared this with an equal area projection which made the distortion stand out, not that it didn’t already. In addition to the visualization aspects of projection, I also explained how to use the tools available in the interface to interact with and change the projection of the current map.
- Geoprocessing
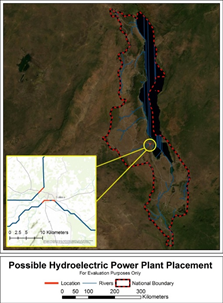
This chapter included instruction on using some of the more common geoprocessing operations such as clip, buffer, erase (difference in MapWindow), and intersection. These operations could be accessed through the use of the toolbox, which houses numerous operations that can be performed on GIS datasets. The tutorial handbook explains how each of these geoprocessing tools work with step-by-step instructions on how to perform each function. The presentation follows a mock case study that simulates the placement of a new hydroelectric power plant in Malawi, Africa, and includes the use of all four of these geoprocessing operations.
- Querying Data Files
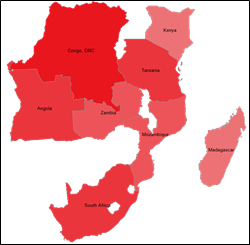
Another vital part of using a GIS is teasing out patterns from data associated with geographic locations. I explored three ways of manipulating a shapefile to get at the data associated with geographic features. First, I explained how the “Select by Attributes” using Structured Query Language (SQL) statements could subset a dataset, while the selection existed, by selecting rows that comply with the SQL query. Next, I demonstrated the “Select by Location” query that allowed the professionals to learn how to select different components of a dataset using spatial means. These queries were used to compare two different datasets by the differences in the location data. For the purposes of the tutorial, I used the “contains” or “does not contain” operations. Finally, I expounded on the definition query and how it could be used to subset a dataset by temporarily “selecting out” data that met certain criteria. Again, by using a SQL query, this could be accomplished but would not disappear once a selection was terminated. Additionally, I showed how this selection would persist for as long as the definition query existed, and how each of these queries has its place in the analysis of GIS datasets.
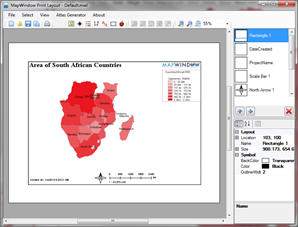
- Layout Creation and Map Printing
This section gives more insight into the offerings of the MapWindow application for labeling features and further enhancing the visualization options for users. Some of these options included font choices, label placement locations around the feature, and font shading that allowed the label better visibility. In addition to these visualizations, creating a layout for printing was also discussed. Part two of this chapter provided a step-by-step example of preparing and printing a product prepared through the previous chapters of the tutorial.
- Metadata Entry
This short chapter essentially explained how to access the data describing the GIS data. There were two methods to do this, the first one produced an XML document viewable in the default web browser. This method was for viewing only, as it produced a read-only document. The second manner was accessible through an expandable document tree in the application. Data could then be entered intuitively and then saved to the metadata master file. To understand the importance of entering metadata the professionals were given the exercise of entering metadata for the data files they had created during this presentation.

This presentation was provided to the professionals in Malawi, Africa in the fall of 2013. My colleagues presented it over the course of a few days and, by all accounts, accomplished what was intended. The tutorial was both comprehensive and basic enough to provide an overview of what could be done with GIS at the time with a tool that would allow these professionals to get their feet wet.
This was a valuable experience for me in learning how to take lessons I had learned, assimilate new knowledge, and communicate all of this to these professionals in a manner that increased their understanding.